GBPUSD
GBP/USD · FX
1.35
-0.00 (-0.12%)
2026-09-15 18:20:27 GMT+7
GBPUSD (GBP/USD) is trading at 1.35, down 0.12% on the session. The technical summary across 22 indicators reads sell. This page shows the live price, a candlestick chart, moving averages, oscillators and key statistics. Data updated 2026-09-15 18:20:27 Vietnam time (UTC+7).
132 daily candles available
Key statistics
Open
1.35
Day high
1.35
Day low
1.35
Volume
233.0K
52w high
—
52w low
—
Avg vol 10d
—
Market cap
—
P/E ratio
—
EPS
—
Div yield
—
Technical summary
25 signalsSummary
Sell
13Sell
5Neutral
7Buy
Pivot 1.35 · support 1.34 · resistance 1.37
Moving averages
| Period | Simple | Exp. | Signal |
|---|---|---|---|
| MA 5 | 1.35 | 1.35 | Sell |
| MA 10 | 1.35 | 1.35 | Sell |
| MA 20 | 1.36 | 1.35 | Sell |
| MA 50 | 1.35 | 1.35 | Sell |
| MA 100 | 1.34 | 1.35 | Buy |
| MA 200 | 1.35 | 1.34 | Buy |
Oscillators
| Indicator | Value | Signal |
|---|---|---|
| RSI (14) | 44.23 | Neutral |
| Stoch %K | 20.61 | Neutral |
| Stoch %D | 24.20 | Neutral |
| MACD | 0.00 | Sell |
| CCI (20) | -108.75 | Buy |
| ADX (14) | 21.20 | Neutral |
| Williams %R | -88.38 | Buy |
| ROC | -0.03 | Sell |
| ATR (14) | 0.01 | Neutral |
| Momentum | -0.00 | Sell |
| Awesome Osc. | -0.00 | Sell |
| Ultimate Osc. | 50.96 | Buy |
| Bull/Bear Power | -0.01 | Sell |
Related news
5 stories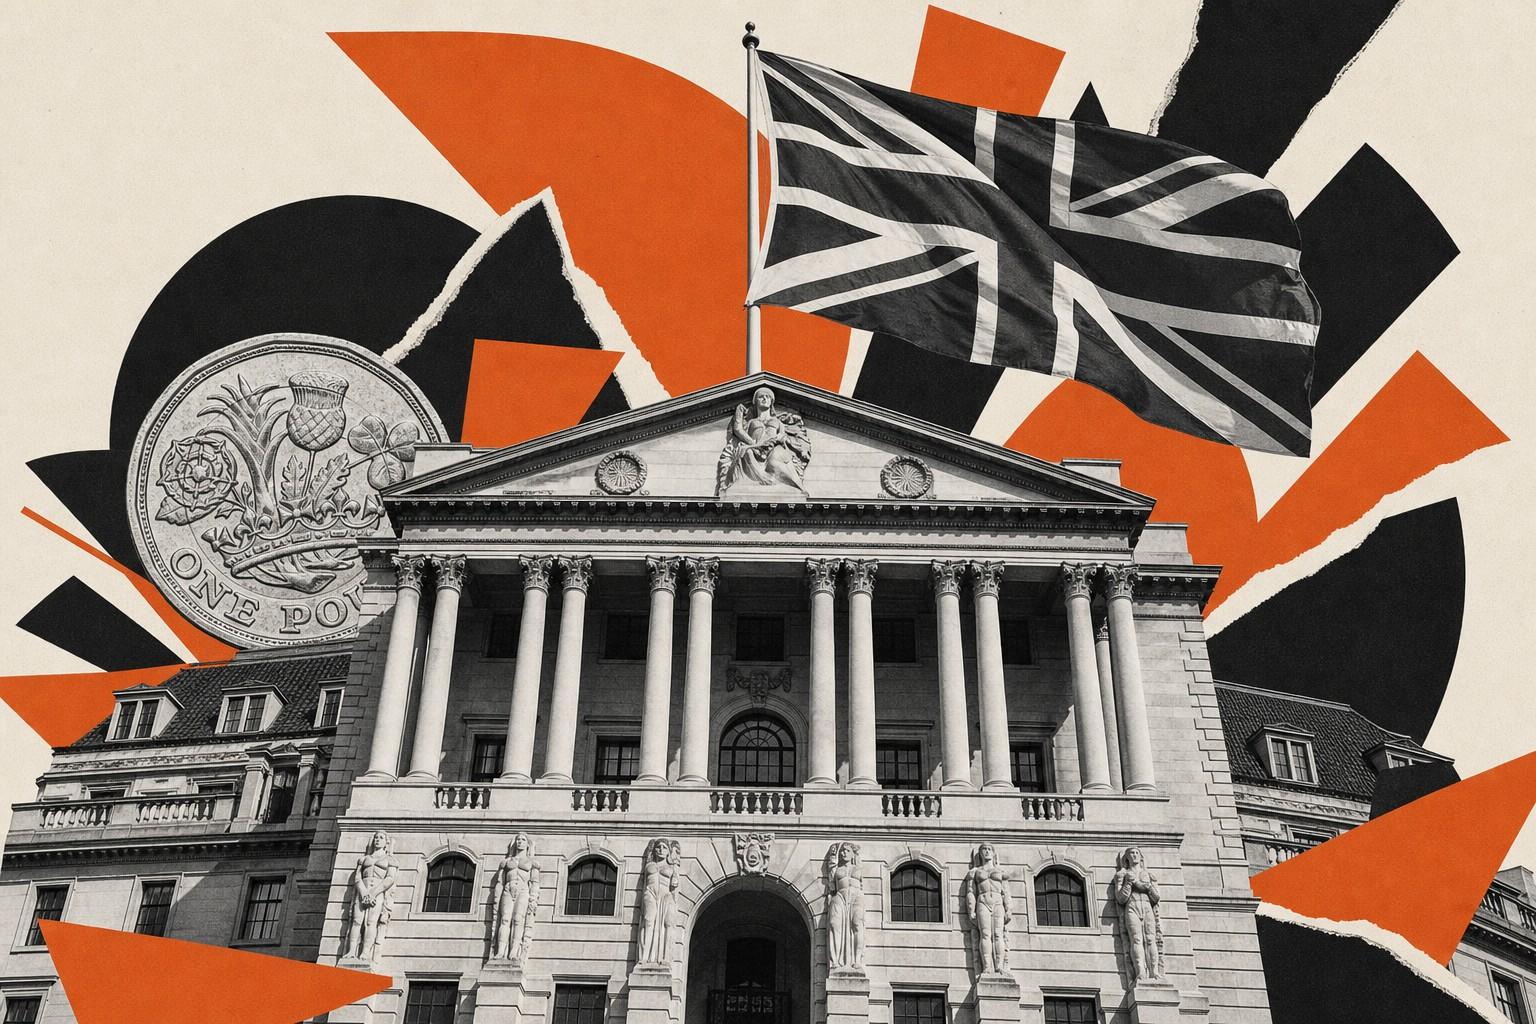 Bank Of England: Jobs data supports steady policy – INGFXFXStreet1h agoGBPUSDUKX
 Bank of England urged to slow or halt bond-selling to slash UK borrowing costsGGuardian4h agoGBPUSDUKX
- British Pound trades mixed after steady UK employment report, CPI data eyedFXFXStreet35m agoGBPUSDUKX
- British Pound: Stronger growth offsets labour weakness – MUFGFXFXStreet2h agoGBPUSD
 State pension likely to top £13,000 a year as UK wage growth slows to 3.9%BBCBBC Business2h agoGBPUSD